Introduction: Functional responses describe the relationship between an individualís rate of consumption and food density. They have generally been divided into three types (see TYPE II and TYPE III FUNCTIONAL RESPONSE). The type I functional response is a linear increase in consumption rate as food densities rise, until reaching a maximum consumption rate. The slope of the line is equal to the consumerís attack rate (also called the capture or searching efficiency). Examples of this type of functional response are somewhat rare; they are most commonly found in herbivoreóplant interactions, and some invertebrate predator-prey interactions.
Importance: A consumerís functional response to changes in food density is an important component of population regulation. The type I functional response is generally assumed to have a stabilizing effect on population dynamics.
Question: Under what conditions is the type I functional response observed? Why does its effect tend to be stabilizing?
Methods: The type I functional response can be described by a linear equation of the form
y = ax + b ,
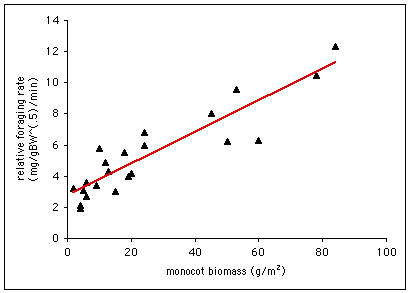
where a is the slope of the line and b is the intercept. In the 1970ís, Batzli et al. measured the functional response of brown lemmings foraging in arctic tundra. The data from early summer in 1976 are graphed below (data redrawn from Batzli et al. 1981).

The relative foraging rate was calculated by dividing the absolute foraging rate(mg/min) by the square root of body weight (gBW.5).
Interpretation: A linear relationship between food density and foraging rate is clearly exhibited. The equation for the line fitted to these data is y = 0.101x + 2.62; the slope of the line is 0.101, and the intercept is 2.62. The authors suggest that the reason the line does not pass through the origin (coordinates [0,0] on the graph) is that the lemmingsí diet included a constant rate of consumption of mosses, whose biomass measurements were not included in the study.
The phase of linear increase in a type I functional response can have a different effect on predator-prey or herbivore-plant dynamics depending on the slope of the line. For a slope equal to one, the risk of being eaten is the same at all population densities. For a slope greater than one, the risk of being eaten increases as food density increases; this tends to stabilize population dynamics. For a slope less than one, the risk of being eaten decreases as food density increases, which also occurs when the consumption rates reach their maximum in a type I response. In this situation there is an inverse density-dependence in which food items in lower-density populations are at greater risk, and the effect of the type I response is destabilizing to population dynamics.
Conclusions: The foraging rates of the brown lemmings did not reach a maximum in this study. Clearly, however, the consumption rates cannot continue increasing indefinitely, regardless of food density! How do we know that this curve does not simply represent the beginning of a type II response? Batzli et al. argue that since they provided the lemmings with the highest food densities found in their natural habitat, it is reasonable to conclude that within the range of naturally occurring food densities, lemmings do indeed exhibit a linear functional response.
A "true" type I functional response is possible when handling time is equal to zero, and predators do not become satiatedó not a realistic situation. However, if an organism exhibits a linear response to the food densities it encounters under natural conditions, as the lemmings did, then for all intents and purposes it is exhibiting a type I functional response and will have a corresponding effect on the prey/food population dynamics.
Additional Question:
1. Are there any other biologically realistic conditions under which a type I response would be seen? What are they?
Sources: Batzli, G. O., H.-J. G. Jung, and G. Guntenspergen. 1981. Nutritional ecology of microtine rodents: linear foraging-rate curves for brown lemmings. Oikos 37:112-116.
Begon, M., J. L. Harper, and C. R. Townsend. 1996. Ecology: Individuals, Populations, and Communities, 3rd edition. Blackwell Science Ltd., Cambridge, MA.
copyright 1999 M. Beals, L. Gross, S. Harrell