Introduction: Animal cells obtain energy in the form of ATP by oxidizing food molecules through the process of respiration. The hydrolysis of ATP supplies energy needed for cellular processes, such as the transport of molecules or cellular movement. Carbohydrates and fatty acids are the most important fuels for generating ATP in animal cells. Respiration in animal cells depends on oxygen. Electrons from the chemical bonds of the fuel source combine with oxygen and hydrogen ions to form water and carbon dioxide. Cells couple this reaction to the production of ATP.
Importance: We can understand a great deal about animal metabolism by comparing the volume of oxygen consumed by an organism to the volume of carbon dioxide produced. These volumes will change depending on the energy source the animal is using.
Question: How can we quantify metabolism? How does the energy source affect the volume of O2 consumed and volume of CO2 produced? How do they differ among animals and how are they affected by environmental conditions?
Variables:
| RQ | respiratory quotient |
| Vc | volume of carbon dioxide released |
| Vo | volume of oxygen consumed |
Methods: One ratio that is particularly useful for understanding animal metabolism is the respiratory quotient. The respiratory quotient (RQ) measures the ratio of the volume of carbon dioxide (Vc) produced by an organism to the volume of oxygen consumed (Vo). This is represented by the following equation:

This quotient is useful because the volumes of CO2 and O2 produced depends on which fuel source is being metabolized. Measuring RQ is a convenient way to gain information about the source of energy an animal is using. We can then compare the metabolism of animals under different environmental conditions by simply comparing RQ.
Carbohydrates, such as glucose, are an important source of fuel. The general formula for a carbohydrate is CnH2nOn. For example, if we take n = 6 we have the formula for glucose, C6H12O6. We can describe the metabolic reaction of a carbohydrate by the following equation:
CnH2nOn + nO2 --> nCO2 + nH2O
Now compare the number of molecules of O2 to the molecules of CO2. We have a ratio of 1 to 1, since there are n O2 and n CO2 molecules.
In order to find the respiratory quotient, we must convert the number of molecules into gas volumes. At standard temperature (273 K) and pressure (760 mmHg), Avogadro's Law says the number of molecules in a given volume of any gas is constant. So we can convert number of molecules to volume by dividing by Avogadro's number (1019 molecules / cm3):

However, since the conversion factor appears in both the numerator and denominator, we can simply use the number of molecules as a substitute for volume. Therefore we can calculate the respiratory quotient for a carbohydrate under standard conditions as
RQ = n / n = 1.
For glucose, RQ = 6 / 6 = 1.
In humans, the use of fats as a fuel source is quantitatively more important than glucose. The general formula for a saturated fat is (CH2O)3(CH2)3n(CO2H)3 . For example, if we take n = 17 we have the formula for the fat glycerol tristearate. We can simplify the formula for a fat to write the following respiration equation:
C3n+6H6n+9O9 + (4.5n + 3.75)O2 --> (3n + 6)CO2 + (3n + 4.5)H2O
We can now calculate the respiratory quotient for a saturated fat. Since n is generally quite large, we will approximate the respiratory quotient as
RQ = (3n + 6) / (4.5n + 3.75) -> 3n / 4.5n = .667
Therefore the metabolism of fat consumes a great deal more oxygen relative to the production of carbon dioxide than the metabolism of carbohydrates.
Example: The value of the respiratory quotient clearly depends on the fuel source being metabolized. By measuring RQ, we can gain insight into properties of animal metabolism under different environmental conditions.
For endotherms, metabolic heat production depends on heat exchange with the environment. Solar radiation can produce physiological effects in small animals, even those possessing insulating coats. One way to determine how metabolism is affected by solar radiation is to look at the respiratory quotient at different air temperatures (Walsberg et al 1997).
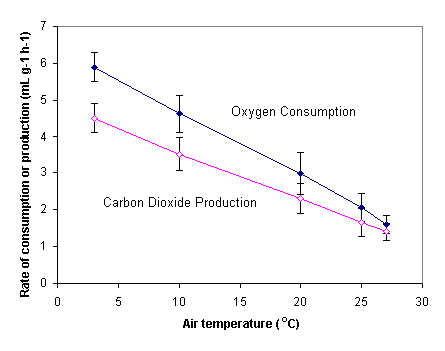
First Walsberg et al measured changes in oxygen consumption and carbon dioxide production for the Siberian hamster approximately 1 hour after food access was removed.
The type of food given the hamster did not change. Their graph of average consumption or production is reproduced below. The error bars give the 95% confidence interval.

Oxygen consumption and carbon dioxide production both declined with increasing air temperature. Notice that the slope for oxygen is somewhat steeper than the slope for carbon dioxide. This implies that the rate of oxygen consumption decreased more strongly with increasing temperature than the rate of carbon dioxide production.
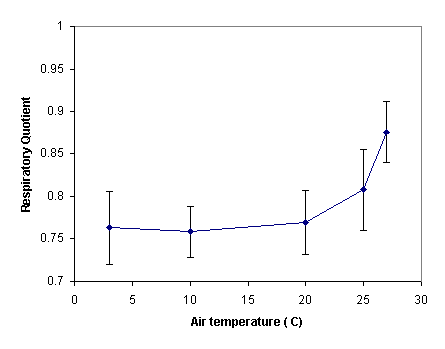
We are less interested in the fact that these rates decrease than in how they affect the respiratory quotient. We can see how these volumes of oxygen and carbon dioxide affect the respiratory quotient by calculating RQ and plotting the values.

Interpretation: We can see that RQ was generally around 0.76 for temperatures below 20° C. Above this temperature, however, the respiratory quotient increased slightly. This is not surprising when we consider the graph of oxygen consumption and carbon dioxide production. At higher temperatures, the rates become more similar, so we expect RQ to get closer to 1.
We can interpret this change in RQ as a change in the energy sources the Siberian hamster uses as temperature increases. At higher temperatures, the hamster is metabolizing about 55% carbohydrates and 45% lipids. At lower temperatures, however, the animal relies more heavily on lipid stores (about 70%) than on the carbohydrates provided by its diet. At lower temperatures, this animal may have increased metabolic demands and rely on body lipid stores.
Conclusions: The energy source an animal is using could be very difficult to measure. Because the chemical content of carbohydrates and lipids is different, the way they are metabolized is different. However, using general rules about oxygen consumption and carbon dioxide production allow us to gain insight into this very thing. It is clear that the respiratory quotient is a fairly simple and informative way to quantify aspects of animal metabolism.
Additional Questions:
1. The respiratory quotient for some animals can change depending on their activity. At rest, a Desert Locust has an RQ of about 1.0. During flight, however, the RQ decreases to about 0.7. How would you interpret this?
2. In rare circumstances, proteins may be used as a source of energy. Proteins are made of amino acids and generally have the structure NH2COOHCH2. The respiration equation for protein is generally given by the following:
C2H5O2 + (x)O2 --> (y)CO2 + (z)H2O
Balance this chemical equation and calculate the respiratory quotient for the metabolism of a protein.
3. In the Siberian hamster experiment, Walsberg et al found the hamster's diet consisted of 26.6% protein, 4.8% lipid, and 68.6% carbohydrate. What would you estimate the respiratory quotient to be if the animal was metabolizing energy sources in direct proportion to their abundance in the diet? How does this compare to the RQ actually found?
Sources:
Darnell, J., H. Lodish, and D. Baltimore. 1986. Molecular Cell Biology. Scientific American Books, Inc., New York
Dudley, B. A. C. 1977. Mathematical and Biological Interrelations. John Wiley and Sons, New York.
Walsberg, G. E., R. L. Tracy, and T. C. M. Hoffman. 1997. Do metabolic
responses to solar radiation scale directly with intensity of irradiance?
The Journal of Experimental Biology 200:2115-2121.
Copyright 1999 M. Beals, L. Gross, S. Harrell