|
| Click image to launch! |
2015 NIMBioS SRE Project Product
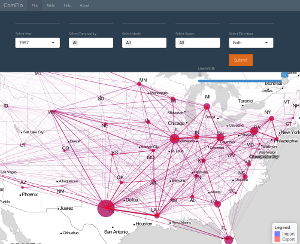
ComFlo
ComFlo is an interactive commodity flow visualization system developed by undergraduate participants in NIMBioS' Summer Research Expriences 2015 as part of the project Ships, ports, invasions and math: Invasive species movements through global shipping routes. ComFlo allows visualization of the flow of 43 commodities into and out of individual states within the United States via seven modes of transport, contributing to an understanding of the movement of invasive species through domestic pathways within the U.S.
Project Participants: Ashish Gauli (Computer Science, Fisk Univ.); Nathan Wikle (Mathematics, Truman State Univ.); Ryan Yan (Mathematical Biology, College of William and Mary)
Project Mentors: Dr. Dan Simberloff; Dr. Louis Gross
User Options: Users select a year to visualize, one or more commodities, one or more states, one or more modes of transport, and direction of commodity flow (import, export, or both). A slide bar in the upper right of the application allows users to select the width of import/export lines. Users may click on the lines on the map to view the tonnage of goods shipped between two states. Results can also be downloaded.
Graph Representation: The flow of imports into a state is represented by a blue line; outgoing flow (exported from the state) is represented by a red line. The width of the line represents the flow of the selected commodity relative to the total flow of that commodity within the United States. The size of the circular node represents the magnitude of commodity flow within a state.
Data Source: Data for ComFlo were obtained from Freight Analysis Framework (FAF). FAF is a comprehensive source of data related to freight movement among U.S. states by all modes of transportation between the years 1997 and 2012. FAF uses historical data to forecast flows for selected years through 2040. ComFlo includes in its visualization system two years of FAF forecast data (years 2015 and 2020).
Application Development: ComFlo was developed using Shiny by RStudio, a web framework for building interactive reports and visualizations using R. The application runs under Shiny Server, an Open Source package designed to put Shiny applications on the web.
This product has been tested on Chrome and Firefox browsers and may not be stable on Safari.
Application URL:
//comflo
For more information about this application, contact: askcomflo@nimbios.org.
For more information about the NIMBioS SRE program,
click here.
NIMBioS
1122 Volunteer Blvd., Suite 106
University of Tennessee
Knoxville,
TN 37996-3410
PH: (865) 974-9334
FAX: (865) 974-9461
Contact NIMBioS